
Friday, August 16, 2019

レナード・N・スターン・スクール・オブ・ビジネス Class of 2021

NYU Stern
got a jump start on introducing their Full-Time MBA Class of 2021. This
week, they released their preliminary class profile on their admissions
website.
Of the 3,518 applicants hoping to join the NYU Stern Class of 2021,
only 919 were admitted and 359 enrolled, for a 26 percent admission
rate. Those students are, on average, 28 years old and have 5.2 years of
professional experience. A few of them were also fresh graduates, with 3
percent having no work experience.
Dramatic Jumps in Academic Performance
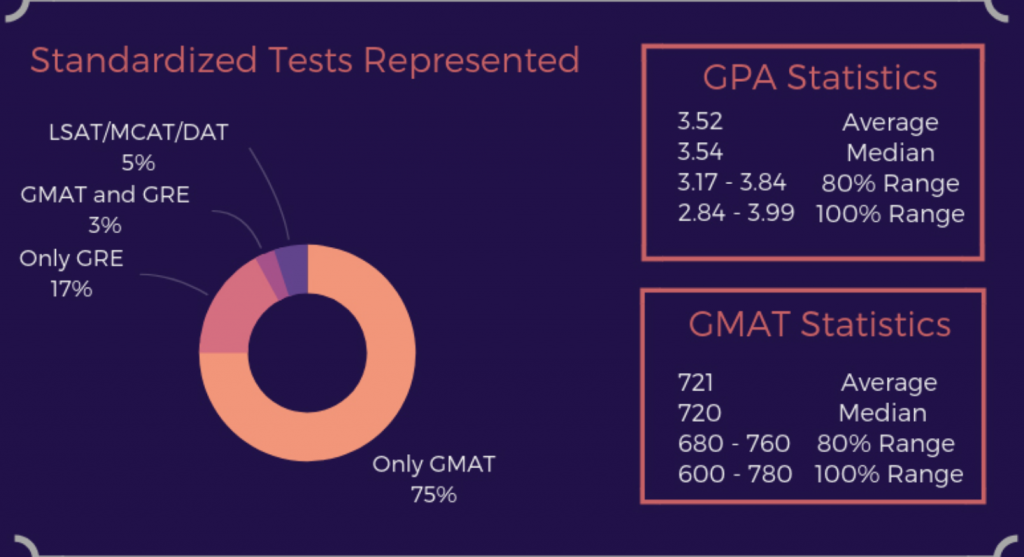
One of the major highlights from the Stern Class of 2021 is the improved academic performance of the candidates.
- The average GMAT score rose 5 points, from 716 to 721
- Average GPAs increased from 3.45 to 3.52
There was also quite a difference regarding undergraduate majors.
While a quarter of the Class of 2020 majored in business, that
percentage increased to 30 for the new group. Meanwhile, the choice of
engineering, math, or science as a major matched last year’s candidates
at 22 percent. The third most popular major for the Class of 2021 was
social sciences (19 percent) followed by economics (15 percent). This is
a reverse of last year when a fifth of the class were economics majors.
Women on the Rise, Veterans Hold Steady
The Stern Class of 2021 is expected to arrive on campus with more
women than last year—female enrollment rose from 35 percent to 36
percent. However, international diversity decreased slightly. Only 33
percent of the Class of 2021 maintains international citizenship in 37
different countries, compared to 39 percent last year.
There was also a slight decrease in the number of minorities
represented in the student body. In the Class of 2021, around a quarter
of students (24 percent) identify as minorities, 9 percent of whom are
underrepresented minorities. That’s down from 29 percent and 13 percent
from last year. However, 7 percent of students are still U.S. Military
veterans or on active duty, which is owed in part to the Fertitta Veterans Program.
Work Experience and Industry Background
Students entering the NYU Stern Class of 2021 come from a wide range
of industries and backgrounds, the most popular being financial services
(28 percent). After that, prior industries are widely mixed with no
other industry breaching 12 percent of the class. They include:
- Consulting, 11 percent
- Technology, 9 percent
- Consumer, Products, Retail, 7 percent
- Nonprofit, Arts, Education, 7 percent
To see the full profile as of July 31, 2019, visit the Stern Full-Time MBA admissions website.
ケナン・フラグラー・ビジネス・スクール UNC / Kenan-Flagler MBA Deadlines 2019-2020
The Kenan-Flagler School of Business has announced the UNC MBA deadlines for the 2019-2020 admissions season.
UNC is conducting its MBA application review process in four rounds
this season. The Early Action deadline is intended for prospective
students who are sure that the Kenan-Flagler MBA is their first choice.
Early Action admits are required to submit a $3,000 deposit to secure
their place in the class enrolling in Fall 2020; this deposit amount is
twice that of the regular decision deadline rounds.
International applicants should note that UNC encourages them to apply in Round 3 or earlier.
Applicants should note that all submissions are due by 11:59pm ET on the date of each deadline.
UNC Kenan-Flagler’s 2019-2020 MBA application deadlines are as follows:
| Round | Application Deadline | Decision Notification | Deposit Due |
|---|---|---|---|
| Early Action | Ocotober 14, 2019 | December 9, 2019 | January 10, 2020 |
| Round 2 | January 6, 2020 | March 2, 2020 | April 6, 2020 |
| Round 3 | March 2, 2020 | April 14, 2020 | May 8, 2020 |
| Round 4 | April 6, 2020 | May 18, 2020 | June 1, 2020 |
Saturday, July 27, 2019
The Most Selective MBAs: 2018 vs. 2015 Applications Per Seat
2018 vs. 2015: Applications Per Seat
Led by Stanford, the most selective
programs also include MIT Sloan, Berkeley Haas, Yale SOM, and Harvard
Business School. Rochester Simon and USC Marshall finished as the only
non-Top 20 full-time MBA programs to place among the best.
| School | 2018 Apps Per Seat | 2015 Apps Per Seat | Difference |
|---|---|---|---|
| Stanford GSB | 18.6 | 19.4 | -0.8 |
| MIT (Sloan) | 13.6 | 10.6 | 3.0 |
| UC-Berkeley (Haas) | 13.1 | 14.3 | -1.2 |
| Yale SOM | 10.9 | 10.6 | 0.3 |
| Harvard Business School | 10.6 | 10.3 | 0.3 |
| New York University (Stern) | 10.2 | 10.9 | -0.7 |
| Rochester (Simon) | 9.9 | 9.2 | 0.7 |
| UCLA (Anderson) | 9.5 | 9.5 | 0.0 |
| Northwestern (Kellogg) | 9.4 | 8.7 | 0.7 |
| USC (Marshall) | 9.1 | 8.0 | 1.1 |
| Dartmouth (Tuck) | 9.1 | 9.0 | 0.1 |
| Arizona State (W. P. Carey) | 8.5 | 5.2 | 3.3 |
| Washington University (Olin) | 8.3 | 11.2 | -2.9 |
| Duke (Fuqua) | 8.1 | 7.6 | 0.5 |
| Penn State (Smeal) | 8.1 | 9.5 | -1.4 |
| Columbia | 8.0 | 7.6 | 0.4 |
| Florida (Hough) | 8.0 | 10.4 | -2.4 |
| Maryland (Smith | 7.8 | 9.3 | -1.5 |
| UC-Irvine (Merage) | 7.7 | 9.4 | -1.7 |
| Rutgers | 7.6 | NA | NA |
| Michigan (Ross) | 7.5 | 7.9 | -0.4 |
| Washington (Foster) | 7.5 | 8.2 | -0.7 |
| Chicago (Booth) | 7.3 | 7.3 | 0.0 |
| Texas (McCombs) | 7.3 | 8.6 | -1.3 |
| Penn (Wharton) | 7.2 | 7.7 | -0.5 |
| Carnegie Mellon (Tepper) | 6.9 | 8.2 | -1.3 |
| Emory (Goizueta) | 6.8 | 8.3 | -1.5 |
| Virginia (Darden) | 6.7 | 7.7 | -1.0 |
| Pittsburgh (Katz) | 6.6 | NA | NA |
| U.C.-Davis | 6.6 | 8.0 | -1.4 |
| Boston College (Carroll) | 6.5 | 6.8 | -0.3 |
| Ohio State (Fisher) | 6.3 | 5.3 | 1.0 |
| North Carolina (Kenan-Flagler) | 6.3 | 8.5 | -2.2 |
| Boston University (Questrom) | 5.9 | 7.3 | -1.4 |
| Indiana (Kelley) | 5.9 | 7.9 | -2.0 |
| Wisconsin | 5.9 | 8.1 | -2.2 |
| Minnesota (Carlson) | 5.8 | 6.9 | -1.1 |
| Georgia Tech (Scheller) | 5.8 | 8.4 | -2.6 |
| Cornell (Johnson) | 5.7 | 6.2 | -0.5 |
| Texas-Dallas (Jindal) | 5.5 | 8.6 | -3.1 |
| Georgetown (McDonough) | 5.4 | 6.9 | -1.5 |
| Texas A&M (Mays) | 5.4 | 7.5 | -2.1 |
| SMU (Cox) | 5.2 | 5.0 | 0.2 |
| Rice (Jones) | 5.0 | 6.7 | -1.7 |
| Purdue (Krannert) | 4.8 | 9.2 | -4.4 |
| Notre Dame (Mendoza) | 4.7 | 5.7 | -1.0 |
| Georgia (Terry) | 4.4 | NA | NA |
| Vanderbilt (Owen) | 3.9 | 5.1 | -1.2 |
| Michigan State (Broad) | 3.9 | 6.3 | -2.4 |
| BYU (Marriott) | 2.4 | 2.6 | -0.2 |
MBA Class of 2018: Overall Admissions Data
Stanford GSB bested all peer schools
in terms of prestige (applications-to-enrollment), but lagged behind
Harvard Business School when it came to applications and yield.
| School | 2018 Acceptance Rate | 2018 Applications | 2018 Admits | 2018 Enrolled | 2018 Yield | 2018 Apps Per Seat |
|---|---|---|---|---|---|---|
| Penn (Wharton) | 21 | 6,245 | 1,294 | 862 | 66.6% | 7.2 |
| Harvard Business School | 11 | 9,886 | 1,031 | 930 | 90.2% | 10.6 |
| Stanford GSB | 6 | 7,797 | 473 | 419 | 88.5% | 18.6 |
| Chicago (Booth) | 23 | 4,289 | 983 | 591 | 60.1% | 7.3 |
| Northwestern (Kellogg) | 22 | 4,471 | 978 | 478 | 48.9% | 9.4 |
| MIT (Sloan) | 13 | 5,560 | 727 | 409 | 56.3% | 13.6 |
| Dartmouth (Tuck) | 23 | 2,621 | 612 | 287 | 46.9% | 9.1 |
| Columbia | 17 | 6,029 | 1,028 | 756 | 73.9% | 8.0 |
| UC-Berkeley (Haas) | 15 | 3,822 | 589 | 291 | 49.4% | 13.1 |
| Yale SOM | 20 | 3,785 | 771 | 347 | 45.0% | 10.9 |
| Michigan (Ross) | 27 | 3,188 | 864 | 423 | 49.0% | 7.5 |
| Duke (Fuqua) | 22 | 3,557 | 798 | 440 | 55.1% | 8.1 |
| Virginia (Darden) | 33 | 2,246 | 739 | 335 | 45.3% | 6.7 |
| Cornell (Johnson) | 33 | 1,600 | 529 | 280 | 52.9% | 5.7 |
| UCLA (Anderson) | 24 | 3,424 | 831 | 359 | 43.2% | 9.5 |
| New York University (Stern) | 23 | 3,781 | 876 | 370 | 42.2% | 10.2 |
| Carnegie Mellon (Tepper) | 35 | 1,628 | 576 | 236 | 41.0% | 6.9 |
| Texas (McCombs) | 34 | 2,076 | 697 | 284 | 40.7% | 7.3 |
| North Carolina (Kenan-Flagler) | 47 | 1,735 | 809 | 276 | 34.1% | 6.3 |
| Emory (Goizueta) | 41 | 1,227 | 501 | 181 | 36.1% | 6.8 |
| Indiana (Kelley) | 38 | 1,084 | 415 | 184 | 43.3% | 5.9 |
| Washington (Foster) | 35 | 934 | 328 | 125 | 38.1% | 7.5 |
| Georgetown (McDonough) | 55 | 1,459 | 806 | 270 | 33.5% | 5.4 |
| Notre Dame (Mendoza) | 48 | 579 | 277 | 123 | 44.4% | 4.7 |
| Rice (Jones) | 40 | 587 | 233 | 118 | 38.8% | 5.0 |
| USC (Marshall) | 28 | 2,017 | 569 | 221 | 38.8% | 9.1 |
| Vanderbilt (Owen) | 62 | 704 | 435 | 179 | 41.1% | 3.9 |
| Georgia Tech (Scheller) | 35 | 495 | 171 | 86 | 50.2% | 5.8 |
| Washington University (Olin) | 33 | 1,115 | 372 | 135 | 36.3% | 8.3 |
| Minnesota (Carlson) | 39 | 529 | 208 | 92 | 44.2% | 5.8 |
| Arizona State (W. P. Carey) | 20 | 764 | 154 | 90 | 58.4% | 8.5 |
| Penn State (Smeal) | 18 | 467 | 82 | 58 | 70.7% | 8.1 |
| Wisconsin | 33 | 465 | 155 | 79 | 51.0% | 5.9 |
| BYU (Marriott) | 53 | 315 | 166 | 131 | 78.9% | 2.4 |
| Michigan State (Broad) | 44 | 323 | 143 | 83 | 58.0% | 3.9 |
| Ohio State (Fisher) | 36 | 588 | 212 | 94 | 44.3% | 6.3 |
| UC-Irvine (Merage) | 27 | 549 | 150 | 71 | 47.3% | 7.7 |
| Purdue (Krannert) | 49 | 231 | 114 | 48 | 42.1% | 4.8 |
| Rochester (Simon) | 32 | 829 | 267 | 84 | 31.5% | 9.9 |
| Maryland (Smith | 36 | 475 | 171 | 61 | 35.7% | 7.8 |
| SMU (Cox) | 46 | 469 | 216 | 90 | 41.7% | 5.2 |
| Boston University (Questrom) | 51 | 932 | 472 | 157 | 33.3% | 5.9 |
| Georgia (Terry) | 32 | 227 | 73 | 52 | 71.2% | 4.4 |
| Pittsburgh (Katz) | 34 | 423 | 144 | 64 | 44.4% | 6.6 |
| Texas-Dallas (Jindal) | 35 | 276 | 97 | 50 | 51.5% | 5.5 |
| Texas A&M (Mays) | 42 | 375 | 158 | 69 | 43.7% | 5.4 |
| Florida (Hough) | 19 | 272 | 51 | 34 | 66.7% | 8.0 |
| Boston College (Carroll) | 44 | 502 | 223 | 77 | 34.5% | 6.5 |
| U.C.-Davis | 39 | 290 | 113 | 44 | 38.9% | 6.6 |
| Rutgers | 36 | 411 | 148 | 54 | 36.5% | 7.6 |
The Most Selective MBA Programs

HAAS AND SLOAN MAKE THE MEDAL STAND
Despite Stanford’s appeal – which includes a Mediterranean climate
and a 10-minute drive to Silicon Valley – it isn’t the only MBA program
that attracts top talent. MIT Sloan has traditionally ranked among the
top programs in terms of applications-to-seats. Over the past three
years, that ratio has jumped from 10.6 to 13.6. The quality of
candidates has risen too, with Sloan enjoying a 15 point rise in average GMATs over the past five years (with an increase in women and international students as well).
U.C.-Berkeley Haas ranks as the 3rd-most selective MBA program at
13.1 applications for a seat in the Class of 2020. The 14th-largest
full-time MBA program, Haas has experienced a point drop in
applications-to-seats over the past three years. This reflects a larger
trend, as Haas has enjoyed a healthy 1.1% increase in applications
during the same period. In other words, more applicants became aware of
the Haas brand. This increased popularity resulted in a slight decrease
in selectivity. Then again, an increase in applications doesn’t always
equate to a surge in truly committed candidates. In the past two years,
for example, Haas’ yield has fallen from 53.1% to 49.4%. Translation:
the drop was driven by tourists not devotees.
SELECTIVITY AIDED BY CLASS SIZE
Yale SOM (10.9) and Harvard Business School (10.6) round out the five
most exclusive programs, trailed closely by New York University Stern
at 10.2 – a 0.7 of a point slide in the past three years. Overall, the
top five programs share a similarity: they are all based on the coasts
near tech epicenters. Excluding Northwestern Kellogg and Rochester
Simon, the ten most selective MBA programs fit this description. Even
there, Rochester Simon defies an easy explanation. Located in
northwestern New York – a six-hour drive to the Long Island Sound – the
Simon School averaged 9.9 applications for every one of its 84 seats.
That number will only increase now that it has become STEM certified, potentially adding 36 months to an OPT work visa for international applicants.
Rochester Simon’s selectivity punches well above its ranking. The
same can be said for Arizona State’s W. P. Carey Business School.
However, the school’s 8.5-to-1 applicant-to-student ratio is part and
parcel of its admissions policy, which had given full-ride scholarship
to every accepted applicant three years (a policy that has since shifted
to providing financial aid to students). Washington University’s Olin
School, a traditional Top 20 outlier, also ranked as the 13th-most
selective MBA program. That said, the school’s 11.2-to-1 ratio in 2015
placed it in the Top 3 – ahead of MIT Sloan and Harvard Business School,
no less. That ratio has since dwindled to 8.3-to-1, thanks to a 29%
decline in applications.

UC Irvine Merage School of Business
Second-tier programs like Penn State (8.1), Florida Hough (8.0),
Maryland Smith (7.9), and U.C. Irvine Merage (7.8) also perform well
with selectivity in contrast to their ranking. That said, each of these
programs houses less than 100 students, meaning a rise in applications
produces a bigger swing in the applicant-to-student ratio than larger
programs. That’s one reason why, for example, Penn State tops Wharton
and Rutgers edges out Chicago Booth in this measure. Aside from Harvard,
scale simply undermines prestige.
Every measure has its downsides. For example, applications-to-seats
isn’t necessarily a barometer of school health. Exhibit A: Brigham Young
University’s Marriott School of Business. It attracts 2.4 applications
for every student it enrolls – the worst conversion among the Top 50 MBA
programs. That said, the school converted 131 of the 166 accepted
applicants into actual students, ranking below just Harvard and Stanford
in terms of yield. In other words, Marriott sealed the deal with 75% of
its targeted candidates – a healthy sign indeed.
Shifting class sizes also impacts selectivity…but not as much as one
might expect. When luxury companies boost inventory, they risk watering
down their distinction. That isn’t necessarily the case in graduate
business education. At Berkeley Haas, for example, the school has added
45 seats since 2015 thanks to increasing physical capacity.
Without this bump, Haas’ applicants-to-seats ratio would stand at 15.5
instead of 13.1. That’s hardly a downfall considering the extra $2.5
million dollars in annual tuition revenue the school generated without any discernible decline in student quality.
Overall, 25 of the top 50 American full-time MBA programs lost ground
over the past three years when it comes to exclusivity. This number,
however, has been influenced by 32 of these schools attracting fewer
applications during this period. What’s more, 10 programs have increased
class sizes by 10 or more students, with another 11 schools trimming
classes by the same amount.
Like any data point, selectivity is a flawed metric that doesn’t
always follow expectations. What’s more, global prestige doesn’t
necessarily equate to a local program’s deep roots with local industries
and employers – where the right alum or opportunity can fast-track any
MBA’s career. Still, prestige matters. Many people associate a personal
brand with an MBA. Earning that degree from a household name confers
credibility and latitude. The sum of thousands of acceptances and
rejections can make a program selective or exclusive. Over time, it is
the learning, experiences, and network that ultimately determines its
prestige.
2019-2020 Early MBA Deadlines
MBA Application Deadlines – Round 1 / Early Action
| School | Deadline | Decision Notification | Essay Released? | Application Open? |
|---|---|---|---|---|
| UVA / Darden Early Action | 9/3/2019 | 10/9/2019 | Yes | Yes |
| IESE Early Decision Round | 9/3/2019 | 10/18/2019 | No | Yes |
| Harvard Business School | 9/4/2019 | 12/10/2019 | Yes | Yes |
| Cambridge / Judge | 9/9/2019 | 11/20/2019 | Yes | Yes |
| Yale SOM | 9/10/2019 | 12/4/2019 | Yes | Yes |
| Stanford GSB | 9/12/2019 | 12/12/2019 | Yes | Yes |
| Indian School of Business | 9/15/2019 | No | ||
| UPenn / Wharton | 9/17/2019 | 12/18/2019 | No | No |
| Notre Dame / Mendoza Early Decision | 9/17/2019 | 11/1/2019 | Yes | Yes |
| Northwestern / Kellogg | 9/18/2019 | 12/11/2019 | Yes | Yes |
| INSEAD | 9/18/2019 | 11/22/2019 | Yes | Yes |
| Duke / Fuqua Early Action | 9/19/2019 | 10/28/2019 | Yes | |
| Berkeley / Haas | 9/26/2019 | 12/12/2019 | Yes | No |
| U. Chicago Booth | 9/26/2019 | 12/5/2019 | Yes | Yes |
| Michigan / Ross | 9/30/2019 | 12/18/2019 | Yes | Yes |
| Emory / Goizueta | 10/4/2019 | 11/29/2019 | Yes | Yes |
| Columbia Early Decision | 10/4/2019 | 11/29/2019 | Yes | |
| UVA / Darden | 10/4/2019 | 12/11/2019 | Yes | Yes |
| CMU / Tepper | 10/6/2019 | 12/11/2019 | Yes | No |
| Dartmouth / Tuck | 10/7/2019 | 12/12/2019 | Yes | Yes |
| Cornell / Johnson October Round | 10/8/2019 | 12/11/2019 | Yes | No |
| UT Austin / McCombs | 10/8/2019 | 12/17/2019 | Yes | |
| IESE Round 1 | 10/10/2019 | 12/5/2019 | No | |
| Rice / Jones | 10/11/2019 | 12/6/2019 | Yes | |
| Duke / Fuqua Round 1 | 10/14/2019 | 12/18/2019 | Yes | |
| Vanderbilt / Owen | 10/14/2019 | 12/13/2019 | Yes | |
| NYU / Stern | 10/15/2019 | 1/1/2020 | Yes | |
| Notre Dame / Mendoza | 10/15/2019 | 12/13/2019 | Yes |
Subscribe to:
Posts (Atom)